FASTER. BETTER. SMARTER.
Helping Lenders Find Better Borrowers™
Empowering lending through accuracy and fairness, Trust Science helps lenders make smarter and faster credit decisions while unlocking new portfolio opportunities. By using advanced AI and unique data sources, we uncover real credit potential that traditional scoring often misses. Our predictive credit scoring technology without increasing risk, and prevents fraud, all while helping more people gain access to the credit they deserve. We’re transforming how credit is understood, creating a system that works better for both lenders and borrowers.
Trusted By:


%20(1).png?width=200&height=85&name=logo%20(1)%20(1).png)
%20(3).png?width=200&height=85&name=logo%20(1)%20(3).png)


.png?width=200&height=85&name=Group%2031%20(1).png)
%20(4).png?width=200&height=85&name=logo%20(1)%20(4).png)
.png?width=200&height=85&name=Group%2031%20(2).png)


%20(1).png?width=200&height=85&name=logo%20(1)%20(1).png)
%20(3).png?width=200&height=85&name=logo%20(1)%20(3).png)


.png?width=200&height=85&name=Group%2031%20(1).png)
%20(4).png?width=200&height=85&name=logo%20(1)%20(4).png)
.png?width=200&height=85&name=Group%2031%20(2).png)


%20(1).png?width=200&height=85&name=logo%20(1)%20(1).png)
%20(3).png?width=200&height=85&name=logo%20(1)%20(3).png)


.png?width=200&height=85&name=Group%2031%20(1).png)
%20(4).png?width=200&height=85&name=logo%20(1)%20(4).png)
.png?width=200&height=85&name=Group%2031%20(2).png)


%20(1).png?width=200&height=85&name=logo%20(1)%20(1).png)
%20(3).png?width=200&height=85&name=logo%20(1)%20(3).png)


.png?width=200&height=85&name=Group%2031%20(1).png)
%20(4).png?width=200&height=85&name=logo%20(1)%20(4).png)
.png?width=200&height=85&name=Group%2031%20(2).png)


%20(1).png?width=200&height=85&name=logo%20(1)%20(1).png)
%20(3).png?width=200&height=85&name=logo%20(1)%20(3).png)


.png?width=200&height=85&name=Group%2031%20(1).png)
%20(4).png?width=200&height=85&name=logo%20(1)%20(4).png)
.png?width=200&height=85&name=Group%2031%20(2).png)


%20(1).png?width=200&height=85&name=logo%20(1)%20(1).png)
%20(3).png?width=200&height=85&name=logo%20(1)%20(3).png)


.png?width=200&height=85&name=Group%2031%20(1).png)
%20(4).png?width=200&height=85&name=logo%20(1)%20(4).png)
.png?width=200&height=85&name=Group%2031%20(2).png)
Credit Bureau+™
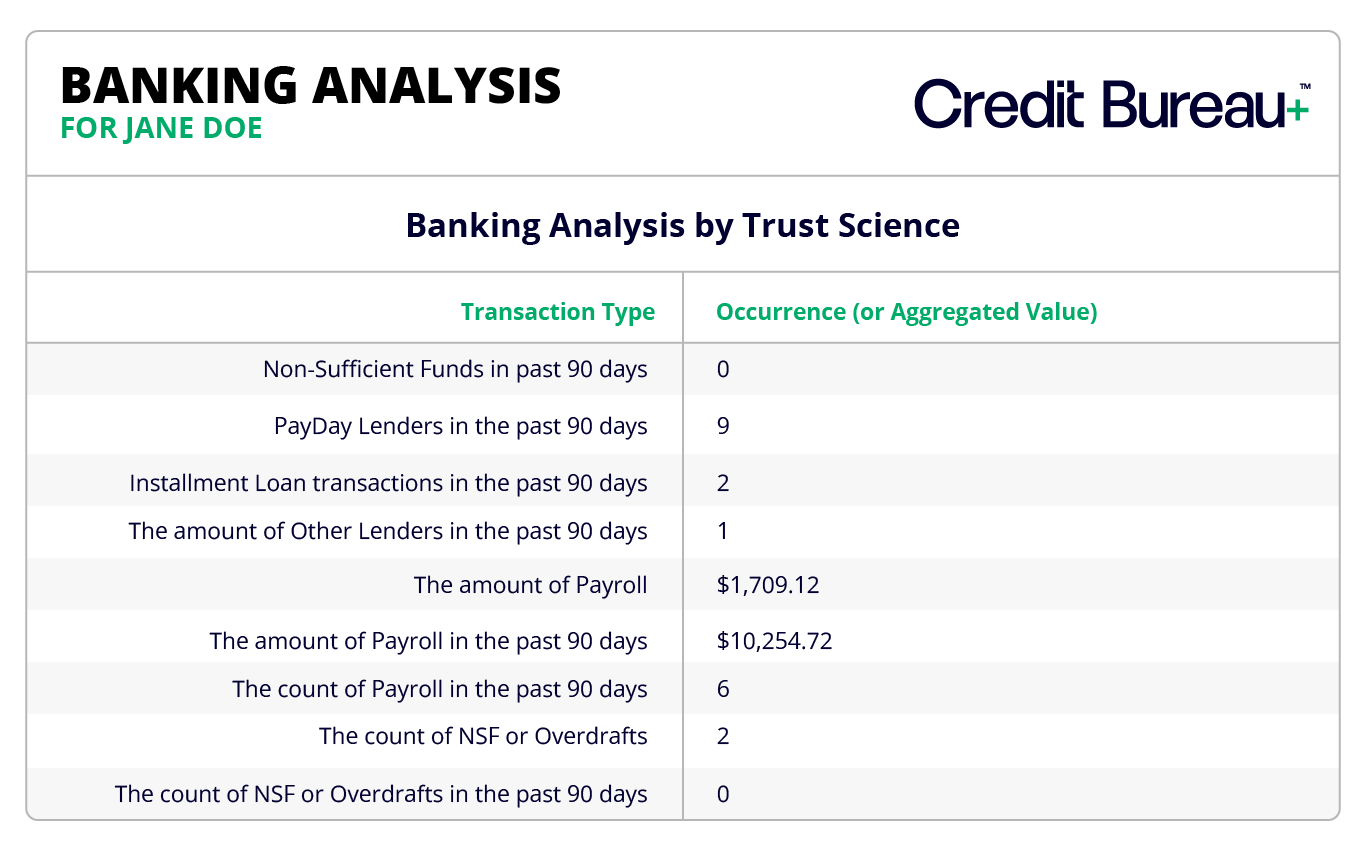
Access real-time, credit data from traditional, alternative, and proprietary data. Purpose-built for modern lending, the platform empowers credit issuers to fight fraud, a complete portfolio of the borrower, and delivers fresh, reliable insights; delivering faster, smarter, and more decisive credit decisions while minimizing risk and discovering new opportunities.
T°Score™
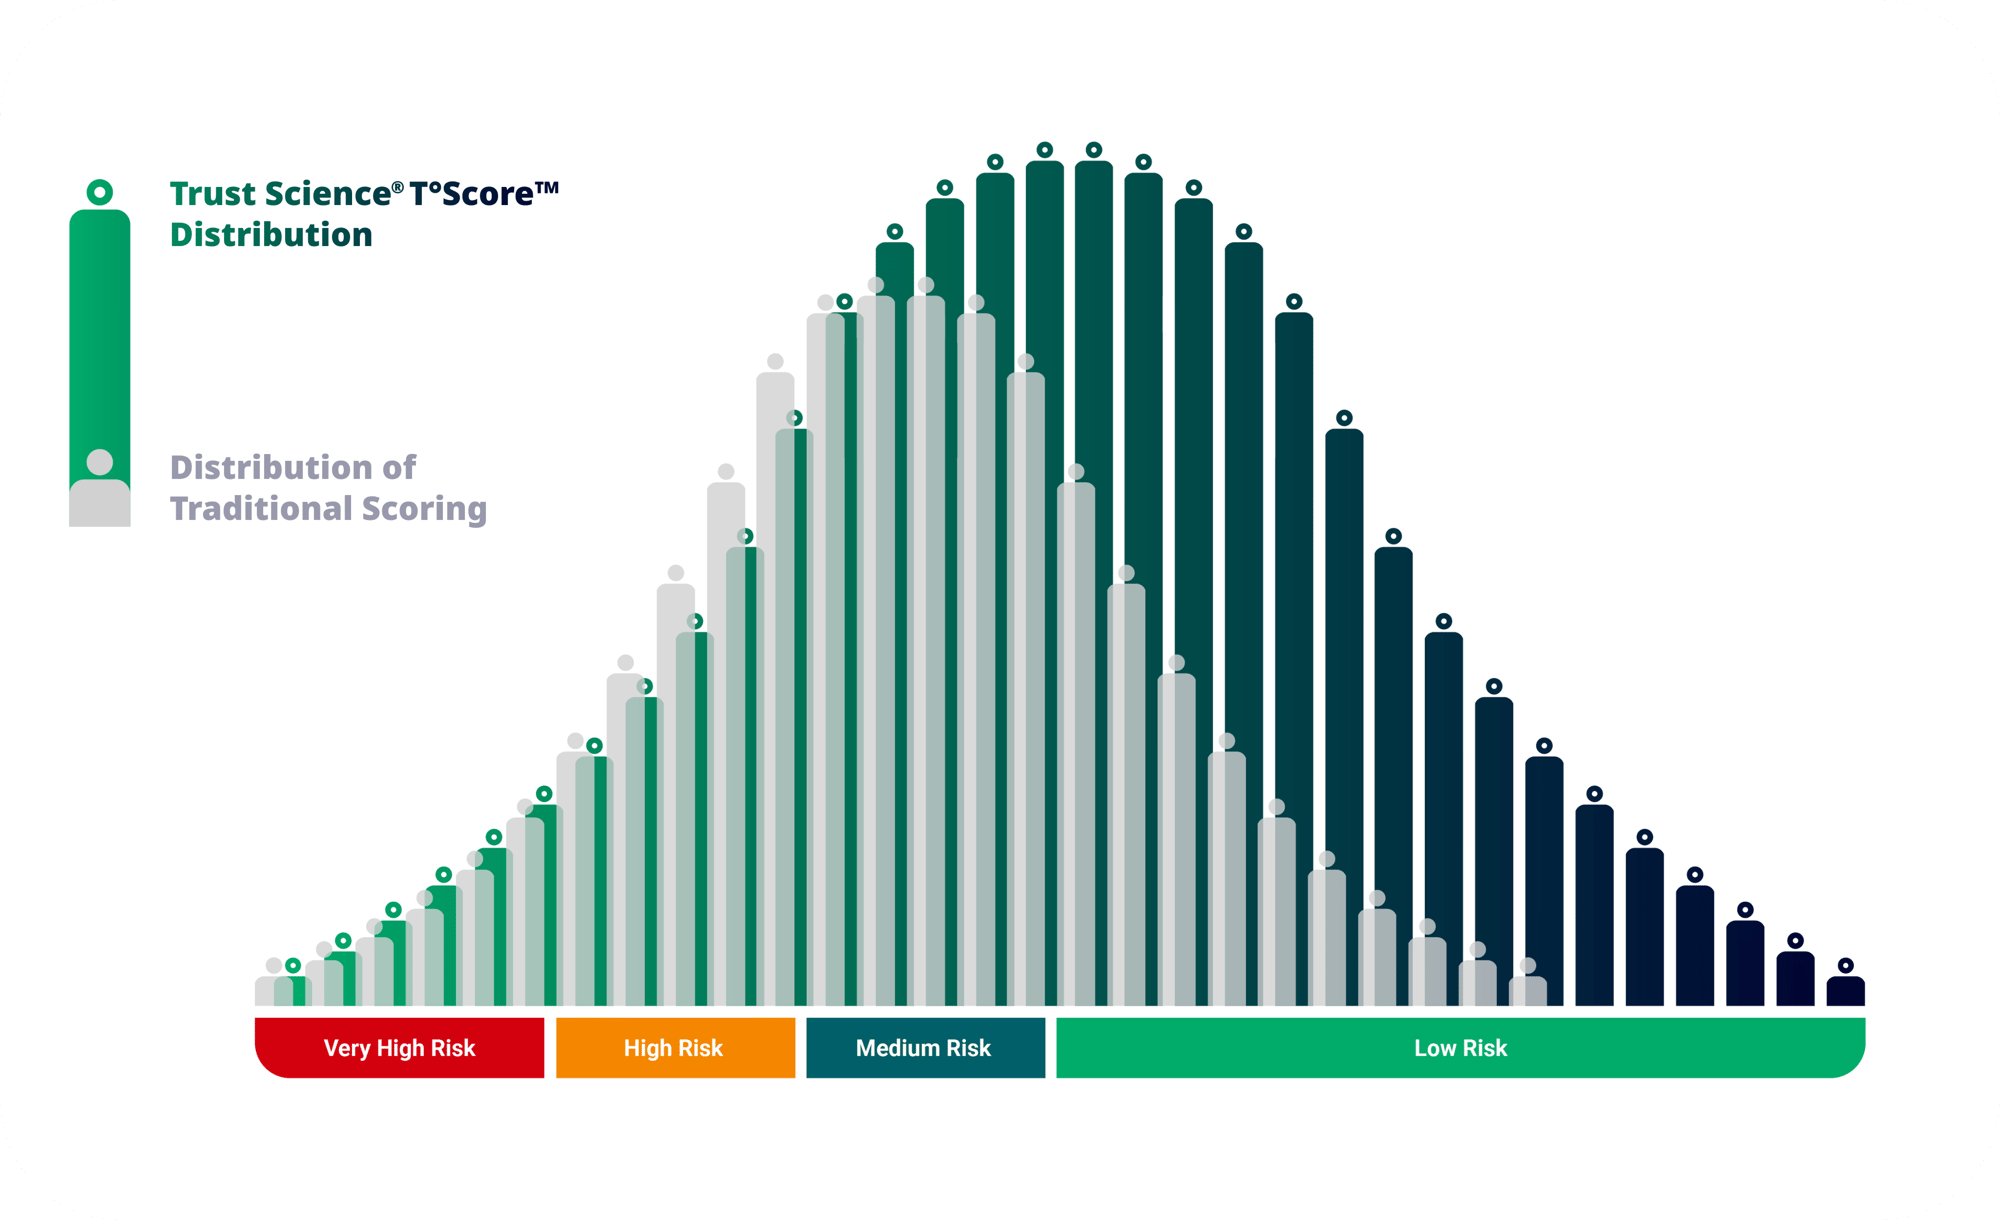
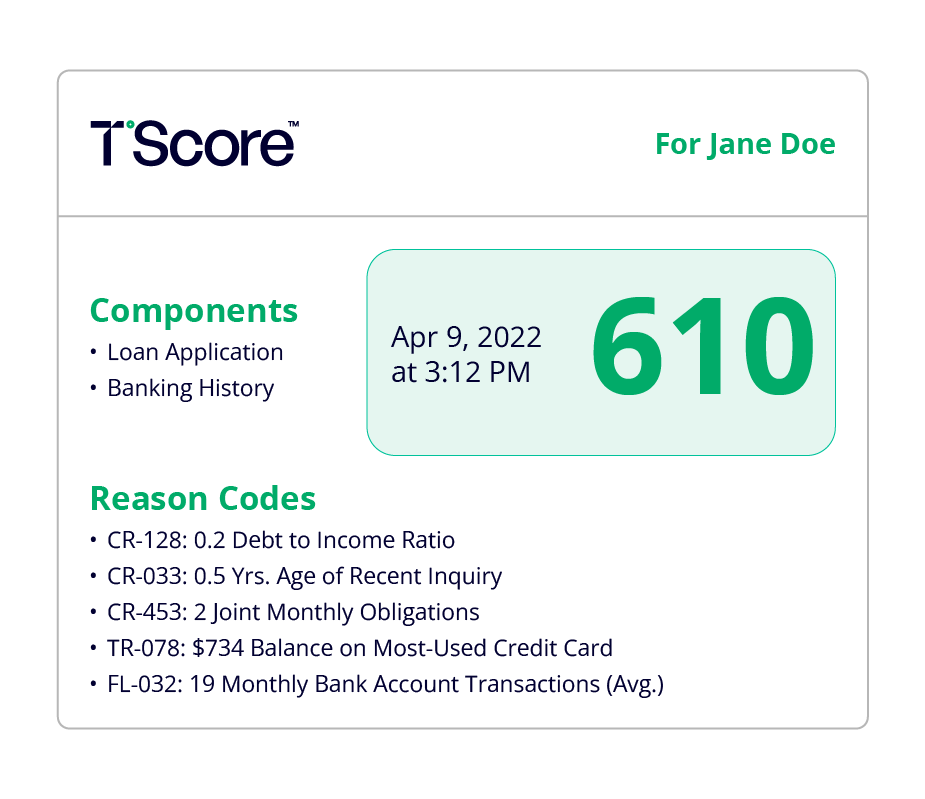
By using our patented technology to combine traditional, alternative, and proprietary data, Six°Score™ provides lenders with a deeper, more dynamic view of every borrower, revealing new opportunities, minimizing risk, and empowering smarter lending decisions. It's a breakthrough innovation that helps identify creditworthy borrowers, including those in the Invisible Prime™ segment, and fuels more inclusive, responsible growth.
CashFlow+™
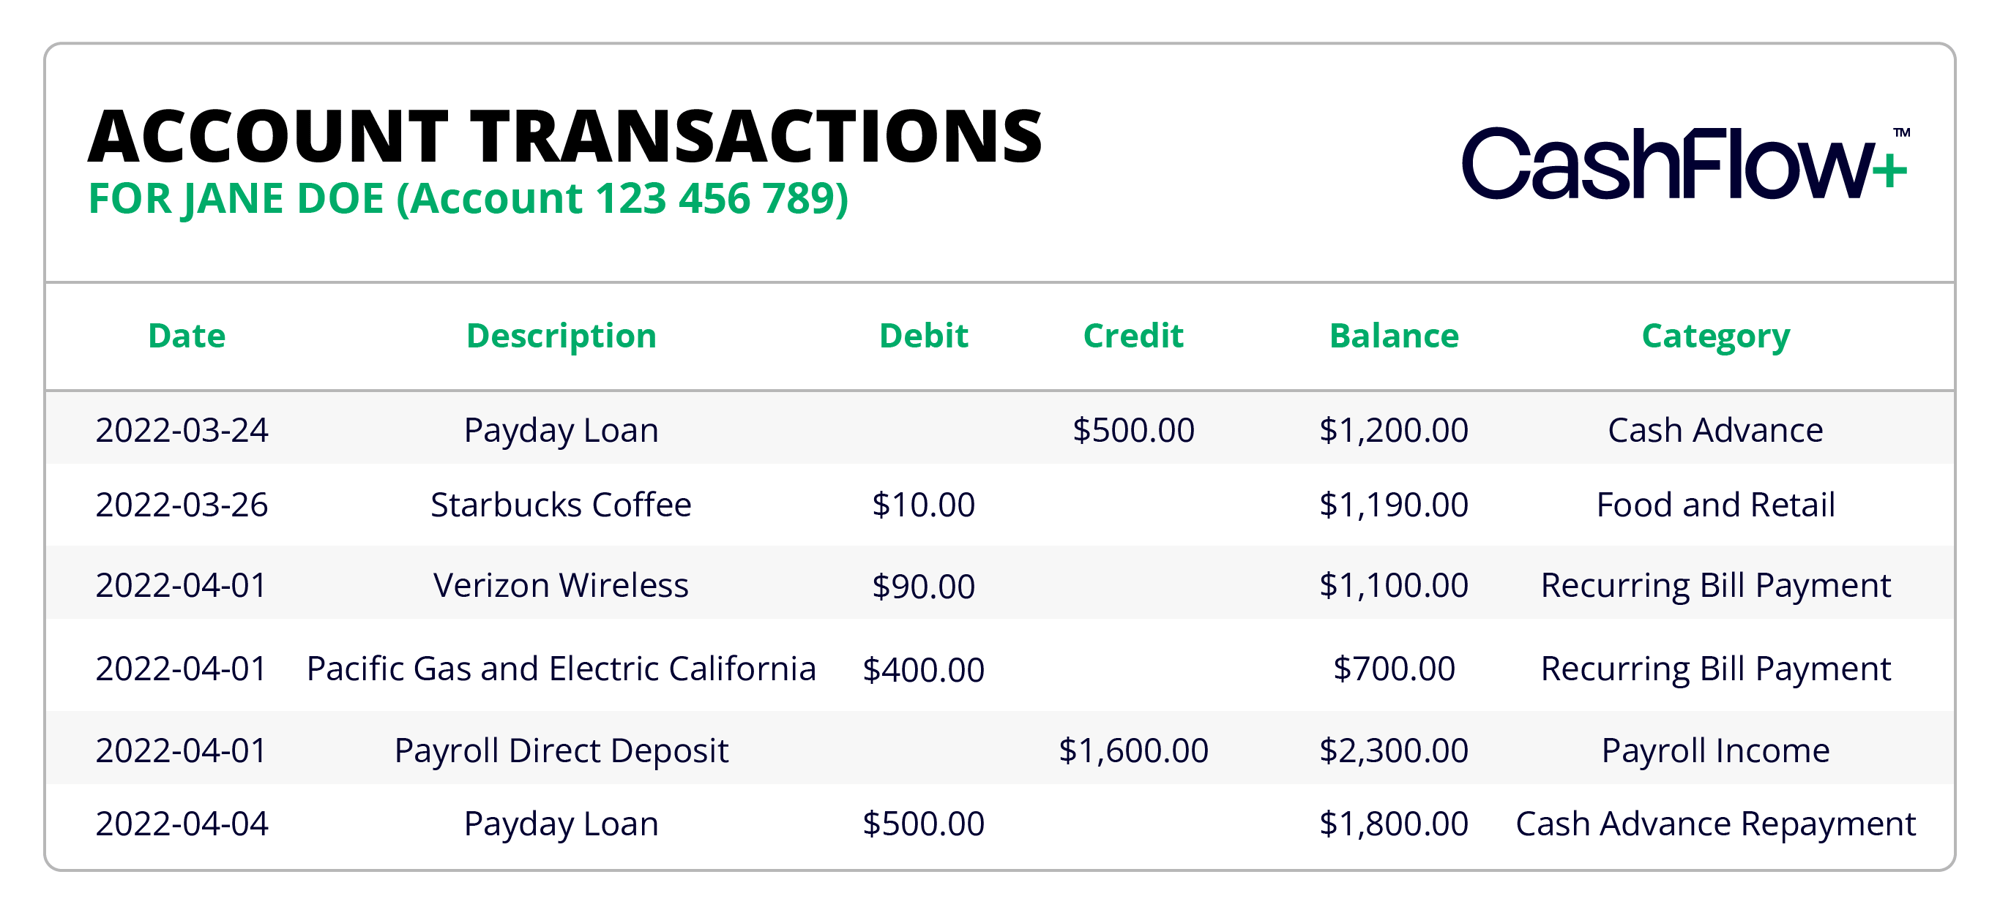
By leveraging advanced data analysis, CashFlow+™ delivers accurate, actionable insights into income patterns, cash flow reliability, and overall financial behavior. This empowers lenders to make confident, data-informed decisions while uncovering new opportunities and minimizing risk.
Services
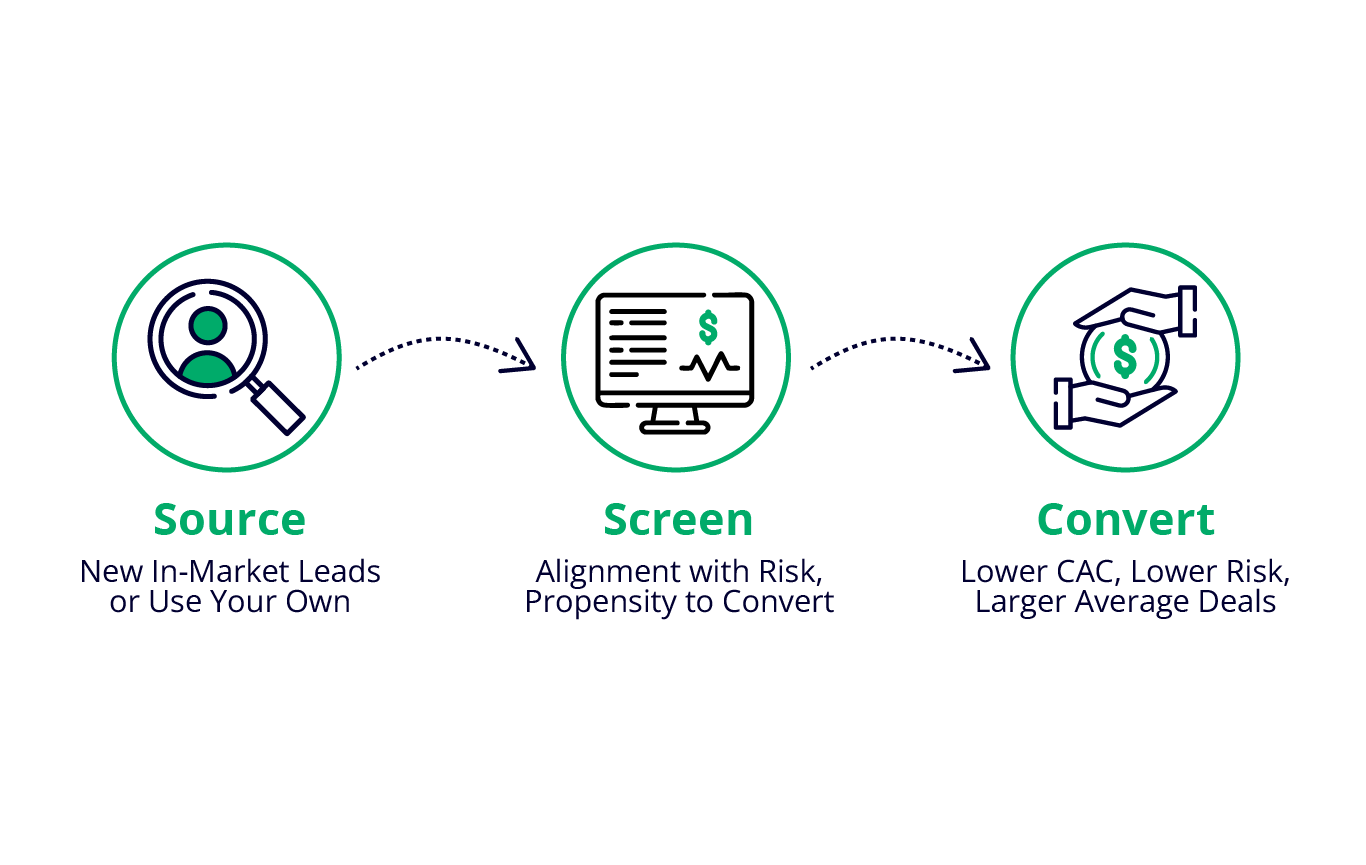
- Customer Acquisition: Reach your ideal customers with targeted campaigns powered by our AI, designed to boost acquisition and conversion based on your specific underwriting needs.
- Risk Strategy: Transform your risk strategy into a competitive edge with our decisioning platform and expert recommendations, enabling you to grow volume confidently while staying ahead of evolving risks.
- Rating Agency 2.0™: Securitize with intelligence using our advanced re-underwriting capabilities, gaining a clearer view of credit quality to make informed buying and selling decisions while minimizing risk.

Credit Bureau+™
Access real-time, credit data from traditional, alternative, and proprietary data. Purpose-built for modern lending, the platform empowers credit issuers to fight fraud, a complete portfolio of the borrower, and delivers fresh, reliable insights; delivering faster, smarter, and more decisive credit decisions while minimizing risk and discovering new opportunities.

T°Score™
By using our patented technology to combine traditional, alternative, and proprietary data, Six°Score™ provides lenders with a deeper, more dynamic view of every borrower, revealing new opportunities, minimizing risk, and empowering smarter lending decisions. It's a breakthrough innovation that helps identify creditworthy borrowers, including those in the Invisible Prime™ segment, and fuels more inclusive, responsible growth.

CashFlow+™
By leveraging advanced data analysis, CashFlow+™ delivers accurate, actionable insights into income patterns, cash flow reliability, and overall financial behavior. This empowers lenders to make confident, data-informed decisions while uncovering new opportunities and minimizing risk.

Services
- Customer Acquisition: Reach your ideal customers with targeted campaigns powered by our AI, designed to boost acquisition and conversion based on your specific underwriting needs.
- Risk Strategy: Transform your risk strategy into a competitive edge with our decisioning platform and expert recommendations, enabling you to grow volume confidently while staying ahead of evolving risks.
- Rating Agency 2.0™: Securitize with intelligence using our advanced re-underwriting capabilities, gaining a clearer view of credit quality to make informed buying and selling decisions while minimizing risk.
1-in-5 Consumers are Invisible Primes™
Over 90 million people in North America lack a fully recognized credit footprint, shutting them out of the financial opportunities they deserve.
We’re breaking barriers and building bridges to ensure that lenders can better serve those who are:
- · Lacking a traditional credit history or profile
- · Recent immigrants and without prior credit records in their new country
- · Part of marginalized groups facing systemic challenges
- · Underbanked or gig workers with unconventional finances
.gif?width=1080&height=1080&name=Untitled%20design%20(2).gif)
What Our Clients Say
Jordan Hyde
Founder & CEO, GoDay
I can't say enough about this company's innovation, professionalism, and speed of execution. They are disrupting the credit scoring and loan decisioning industry and it's about time.
Steve Malone
President, AutoCapital Canada
Working with Trust Science, we have been able to support and enhance our legacy workflow, knockout rules, and business/strategy stipulations with high ROI.
Richard Evans
Chief Product Officer, ConsumerCapital Canada
Today, we rely on Trust Science in every application we look at. The Six°Score™ underpins our decisions.
Mark Eleoff
Founder & CEO, Eden Park - a subsidiary
"Trust Science and its "Credit Bureau +" service exceeded my expectations and continues to do so. The service properly and accurately scores consumers who are very hard to score."
Better Decisions, Better Results
Actual results experienced by lenders using Credit Bureau+™
27.9%
15.2%
13.5%

Start Approving More Borrowers, Without Increasing Risk
From powerful credit insights to real-time risk assessment tools, our products are designed to help lenders make smarter, faster, and safer lending decisions. Approve more borrowers with confidence, streamline your processes, and safeguard your portfolio with Trust Science by your side.

